Permissions
You will require an Access Role with the following permissions:
- Reports
General Details
- Navigate from the Home page to Reports.
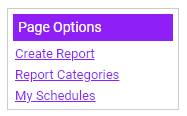
- Click Create Report from the Page Options menu.
- Complete the following General Details and select the appropriate options to customise your report:
Field Description Report name You are required to enter a title for the report before continuing to the next stage. This title should also be unique. Description A short message informing users what the report is used for. Report category Select the category to store the report within. Categories can be account-wide or personal.
Note: Any reports located in a personal category will only be seen by the user who created the report. A report can also be edited at any point to change its location. For more information on Report Categories view Create a Report Category.What would you like to report on? This specifies the area of data that the report will use as a base. Changing these options will give you access to the different areas within your product.
Selecting Expense Items from the dropdown list will automatically add the following filters to the report:- Claim Submitted Equal To Yes
- Claim Paid Equal to Yes
Note: The report base you choose will determine your access to the different areas within the product and should be chosen carefully to match the data that you wish to report on.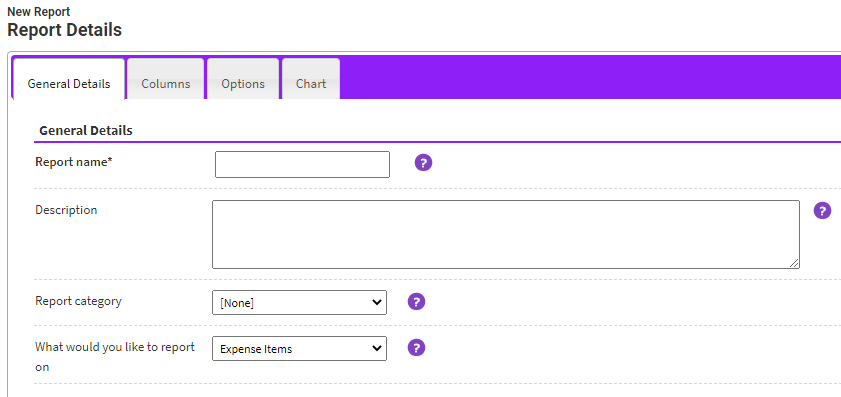
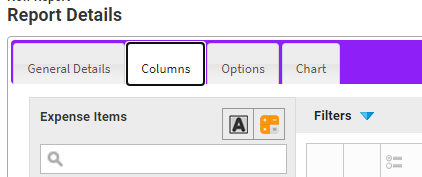
- Once you are ready to move on to defining the data for the report, click on the Columns tab. Information on this can be found in the Columns tab at the top of this article.
Note: By clicking Save at the end of each section, the product will save any changes and close the Report Details page. Ensure that you have made the correct selection for what you would like to report on as this will be locked upon clicking Save.


Report Columns
To create a report you must first build the columns that will appear within the report. Selecting from a pool of available fields will determine the columns and how they are ordered within your report. In order to build these columns, follow the steps below:
Note: For detailed information on creating Static and Calculated Columns, view Create a Static Column and Create a Calculated Column.
- From the Report Details page, click the Columns tab.
- The field selector lists all of the fields which you can report on. The fields available are determined by which Product Area you have chosen to report on during Part 1 of this guide (the product area is displayed above the field selector).
- Some fields within the field selector will allow you to drill down to a greater depth.
Tip: You can use the search field
 to help refine the list of fields.
- Fields labeled with
 can be expanded to display further linked fields.
 - Fields labeled with
 cannot be expanded but can be selected to build report columns.
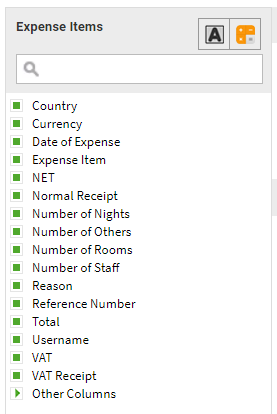
- Fields labeled with
- The field selector lists all of the fields which you can report on. The fields available are determined by which Product Area you have chosen to report on during Part 1 of this guide (the product area is displayed above the field selector).
- Click and drag a field from the field selector into the Preview window to add a report column. Once a column has been added, the preview window will offer a short delay before displaying any report data which will allow you to add multiple report columns in quick succession. When dragging a field over the preview, a vertical blue line will display to show where the column will be added if you drop the field in that position.
Action Description Delete a Column Click  within the column header to open the context menu and then click
  . Alternatively, drag the column header back over the field selector to remove the column from the report. The preview window will update automatically. A warning will display if you attempt to delete a column which is used within the report chart.
Edit a Column Click  within the column header to edit the column (only applicable to Static and Calculated columns).
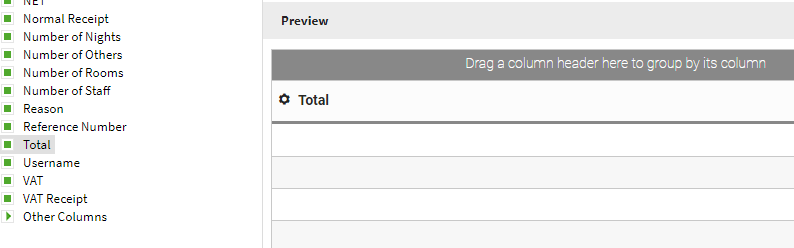
- Once you have built the report columns within the preview window, you can use the following options to further configure the report:
Action Description Reorder columns Click the relevant column header and drag it left or right into a new position within the report grid. If you have a large number of columns, the preview window will automatically scroll when a column is dragged into a new position which is not immediately visible. Sorting Click a column header to sort the data within that column into ascending order, descending order or not sorted. The column is not sorted by default.
You can also sort multiple columns by holding down Ctrl on your keyboard and then clicking the headers of the columns that you want to sort.Hide this column Click to open the context menu. This will display the Hide  option which you can select if you want this specific column to be hidden from the report data when run.
When hidden, the will appear in the column header.Aggregate functions Aggregate functions can be used to tailor the report data to specific requirements. Click to open the context menu where you can apply different aggregate functions to numerical columns. For more information on aggregate functions, view Aggregate Functions.
Note: Only one aggregate function can be applied per report column. To apply multiple aggregate functions you will be required to add the report column to the grid multiple times. Aggregate functions cannot be added to Calculated and Static Columns.Grouping Group the report data by columns within the report. For example, if you had a report on employee expense spend, you could group the report data by the Job Title column which will allow you to analyse reimbursements per job role.
Drag and drop a report column into the blue bar above the preview grid to group the report data. This will rearrange the report data, now grouped by the selected column.- Group the report data further by dragging more report columns on to the blue bar above the preview grid. Once you have grouped by more than one column, indicators will display in the column header to show the order in which the report data has been grouped.
- Once grouped, you can also sort by clicking the column header of the other columns that you want to sort by.
To remove a report grouping, hover over the grouping column and then click .
.
- Group the report data further by dragging more report columns on to the blue bar above the preview grid. Once you have grouped by more than one column, indicators will display in the column header to show the order in which the report data has been grouped.
- Once you have finished building and defining the columns you can start to define the criteria which will allow you to filter the report data. Information on this can be found in the Criteria tab at the top of this article.

 to help refine the list of fields.
 can be expanded to display further linked fields.
 cannot be expanded but can be selected to build report columns.
 within the column header to open the context menu and then click
  . Alternatively, drag the column header back over the field selector to remove the column from the report. The preview window will update automatically. A warning will display if you attempt to delete a column which is used within the report chart.
 within the column header to edit the column (only applicable to Static and Calculated columns).
 option which you can select if you want this specific column to be hidden from the report data when run.
 .
.Additional Information
Within the Options tab, you can configure the following data related options:
| Option | Description |
|---|---|
| Can users view this report for their own data? | Select this checkbox if you would like other users to be able to view your report for their own data. |
| Limit results | Selecting this checkbox will allow you to limit the results that will be returned for the report. If you activate this option another field will appear that requires you to specify the maximum number of report rows to return. |
Report Criteria
Using filters will provide greater control over reporting by allowing you to filter large amounts of report data to return results which are specific to your requirements. In this guide, we will be filtering a list of employees so that we can view the details of an individual employee.
- From the Report Details page, click the Columns tab.
- Drag and drop a field from the field selector into the Filters section.
Tip: You can use the search filter to help refine the list of available fields.
- Dropping the field into the Filters section will display the Filter Detail window. This will allow you to filter the report data by the field you have chosen in a variety of different ways. The Filter Criteria options available to you will depend on which field you have selected to filter by. For in-depth guidance and examples of filter criteria, view Criteria Definitions.
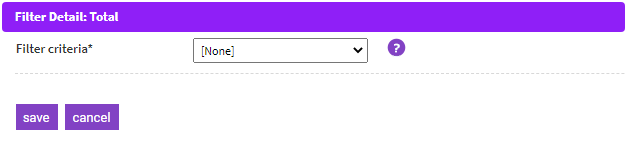
- Select a Filter Criteria which will allow you to filter the data correctly, based upon the value you intend to enter.
In this example, we need to find a specific employee from a list of employees. Filtering by First Name equals "Gary" will allow us to view each employee who has that first name. You can continue to add fields to filter the report data further.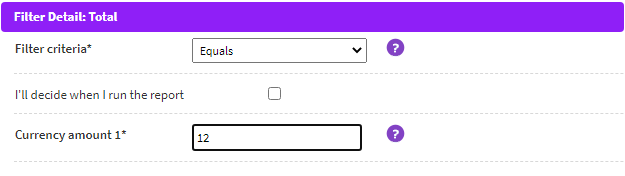
Note: If you would rather define the value of the filter when the report is run, you can specify this by selecting the I'll decide when I run the report checkbox. This is useful for a report where the filter criteria needs adjusting each time it is run, for example changing a date range. Filters which are selected when running the report will not be applied to the preview report, therefore data may not appear as expected until the report is run.
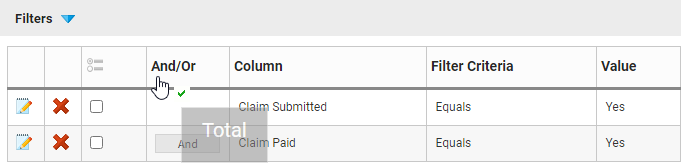
- Once you have added the filter you can perform further actions listed below:
Action Description Remove Filter Click to remove the filter which was previously specified.Edit Filter Click  to edit the filter which was previously specified.
And Click  to filter the report data by this filter and the filter above (not applicable for a single filter).
Or Click  to filter the report data by this filter or the filter above (not applicable for a single filter).


 to edit the filter which was previously specified.
 to filter the report data by this filter and the filter above (not applicable for a single filter).
 to filter the report data by this filter or the filter above (not applicable for a single filter).
Grouping Filters
Filters can be grouped to allow more organised and complex filtering of report data. It is considered best practice to understand how you plan to group the filters at the stage where you have added the specific fields into the filter box. This allows you the freedom to change the order of the filters before grouping them together. Once a selection of filters are grouped, they cannot be re-ordered unless the grouping has been removed.
To group a selection of filters, follow the steps below:
- Ensure that the filters which are to be grouped are ordered consecutively.
- Tick the checkboxes of the filters that are to be grouped.
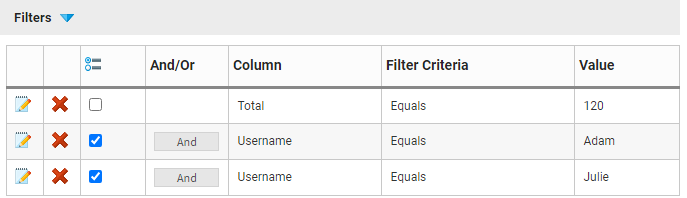
- Click on the group icon
 which will group the selected filters, indicated by the blue bar. To ungroup the filters, click group icon within the blue bar.
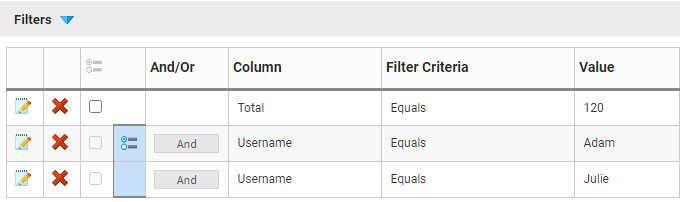

 which will group the selected filters, indicated by the blue bar. To ungroup the filters, click group icon
Example:
If applied to a similar situation as above, you can use the filters, grouping and logical operators (and/or) to create neat and precise report data.

The above image shows that we are filtering the report data to return users who have the username of either Adam or Julie and a total of 120.
