Permissions
You will require an Access Role with the following permissions:
- Reports
- Navigate from the Homepage to Reports.
- Edit the report you want to create the chart for.
- From the Report Details page, click Chart.

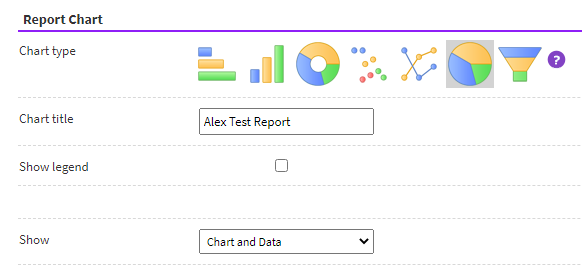
- Specify the following options for the chart:
Option Description Chart Type The type of chart to display the report data in. You can select from the following chart types: - Bar
- Column
- Donut
- Scatter
- Line
- Pie
- Funnel
Chart Title Enter the title to use for the chart. Show Legend Select this option to display the legend alongside the chart. The legend provides an explanation of the symbols used.
If selected, use the Legend Position field to determine where the chart will be displayed.Show Use this option to select whether you want to display: - Chart and Data
- Data Only
- Chart Only

Note: Once you have selected report columns for the X-Axis/Values and Y-Axis/Wedges a preview of the report will be displayed. This will then update automatically depending upon which options you specify. Hover over the chart preview to enlarge.
Option Description X-Axis/Values Select the report column which will be used to populate the X-Axis/Values on the chart. Y-Axis/Wedges Select the report column which will be used to populate the Y-Axis/Wedges on the chart. In order for the report columns to appear in this drop down menu, the report column must have an aggregate function applied (e.g. Sum, Count, Average etc). Group By Select the report column to group the Chart Data by. This will produce multiple series of data. Collected Threshold Percent Use this option to set the threshold (%) of items which will be grouped into a single item of "Other".
For example, if the Collected Threshold Percent is set to 5%, any items which make up less than 5% of the report data will be grouped into the "Other" category.Option Description Chart Title Font/Colour Select a Font Size (pt) for the chart title.
The field adjacent to this allows you to select a colour for the chart title. Enter a HEX code into the field (default is 000000) or click to select a colour from the colour picker.
Text Font/Colour Select a Font Size (pt) for the chart text.
The field adjacent to this allows you to select a colour for the chart text. Enter a HEX code into the field (default is 000000) or click to select a colour from the colour picker.
Show Labels Selecting this option will show the label of the chart element. This is taken from the X-Axis value. Show Values Selecting this option will show the value of the chart element. This is taken from the Y-Axis value. Show Percent Shows the value of the chart element as a percentage of the total. This is taken from the Y-Axis value. Chart Size Select the size of the chart. Background Colour Select a colour for the chart background. Enter a HEX code into the field (default is FFFFFF) or click  to select a colour from the colour picker.
- Click Save at the bottom of the page to store the chart against the report. When the report is run, the chart will be displayed above the report data, unless you have selected the Data Only option.


 to select a colour from the colour picker.
